Dr. John Snow's map is a visual representation of cholera epidemic from the 19th century, this outbreak caused large-scale transmission of the disease. John Snow discovered Cholera disease when he investigated a spread in the Soho district of London. Theory believed that the disease was transmitted or spread by bad air, John snow was the one who knew that cholera was transmitted throught the contaminated water. In 1854 the physician made a huge contribution in fighting cholera and was able to demonstrate how the contaminated public water pump was causing cholera in that region. He made great contributions which led to some positive changes as the water pumps used for drinking were disables, decrease in the number of deaths.
Design Process
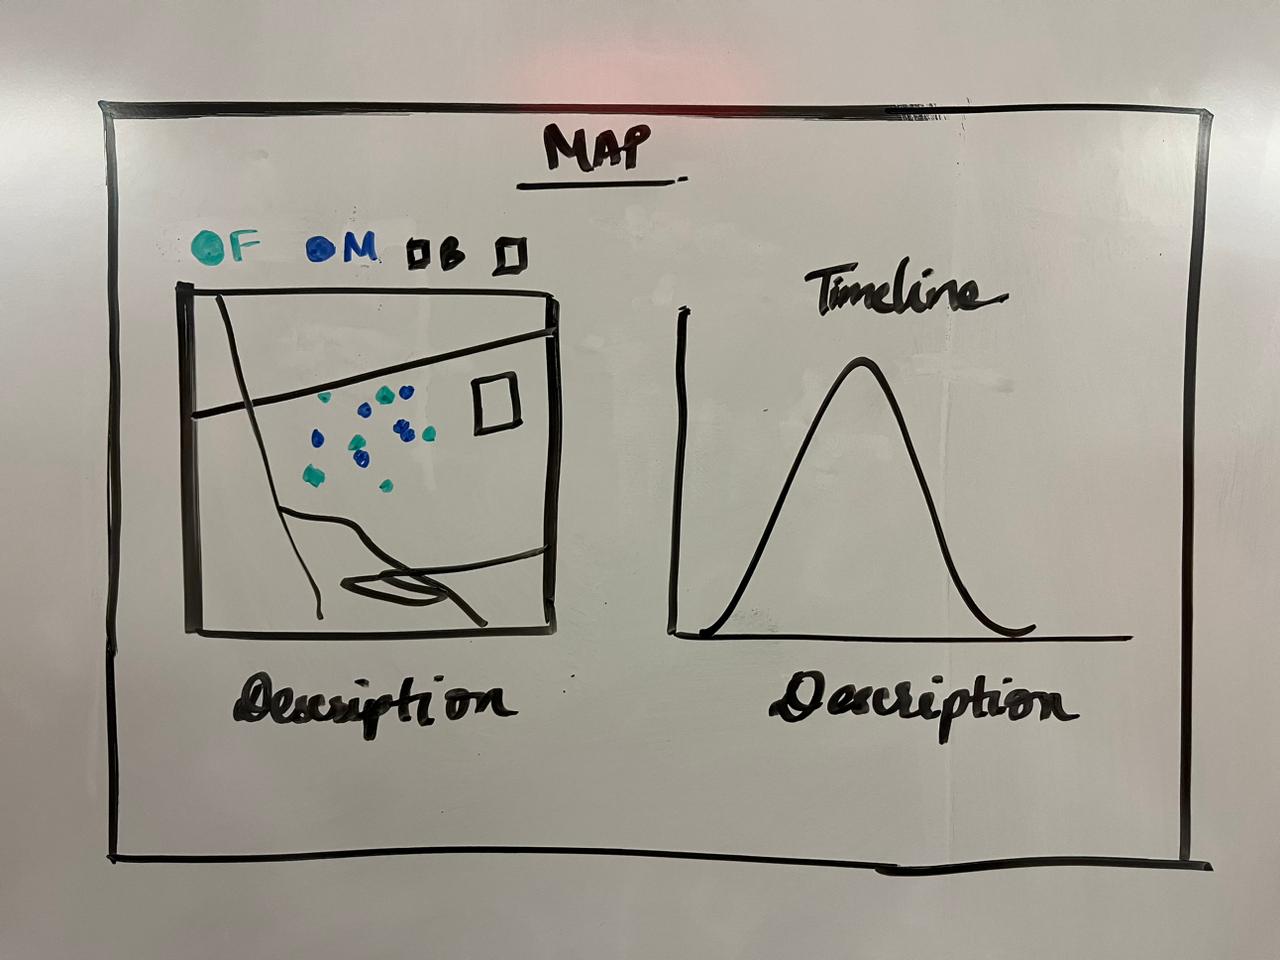
I was excited to recreate Dr. John Snow's cholera map visualization. The very first step in visualization is analyzing the given data, I went through the data files to check and understand the type of data columns, JSON file which describes the paths for the map. I started by working on the map using JSON file where I successfully created the map lines for the paths from the given data.
By referring to websites and reading the D3 book I understood the concepts of creating the different types of graphs such as the line chart, bar graphs and the pie charts.
Cholera Epidemic map of london was recreated by importing the csv data file and json file to first draw the street lines of the map. After creating the street lines I focused on naming streets and positioning the work-house circle, brewery and the pumps into the map.
Implemented the visual encoding hovering on the timeline graph, we can see the number of deaths occurred on the particular dates on the map.
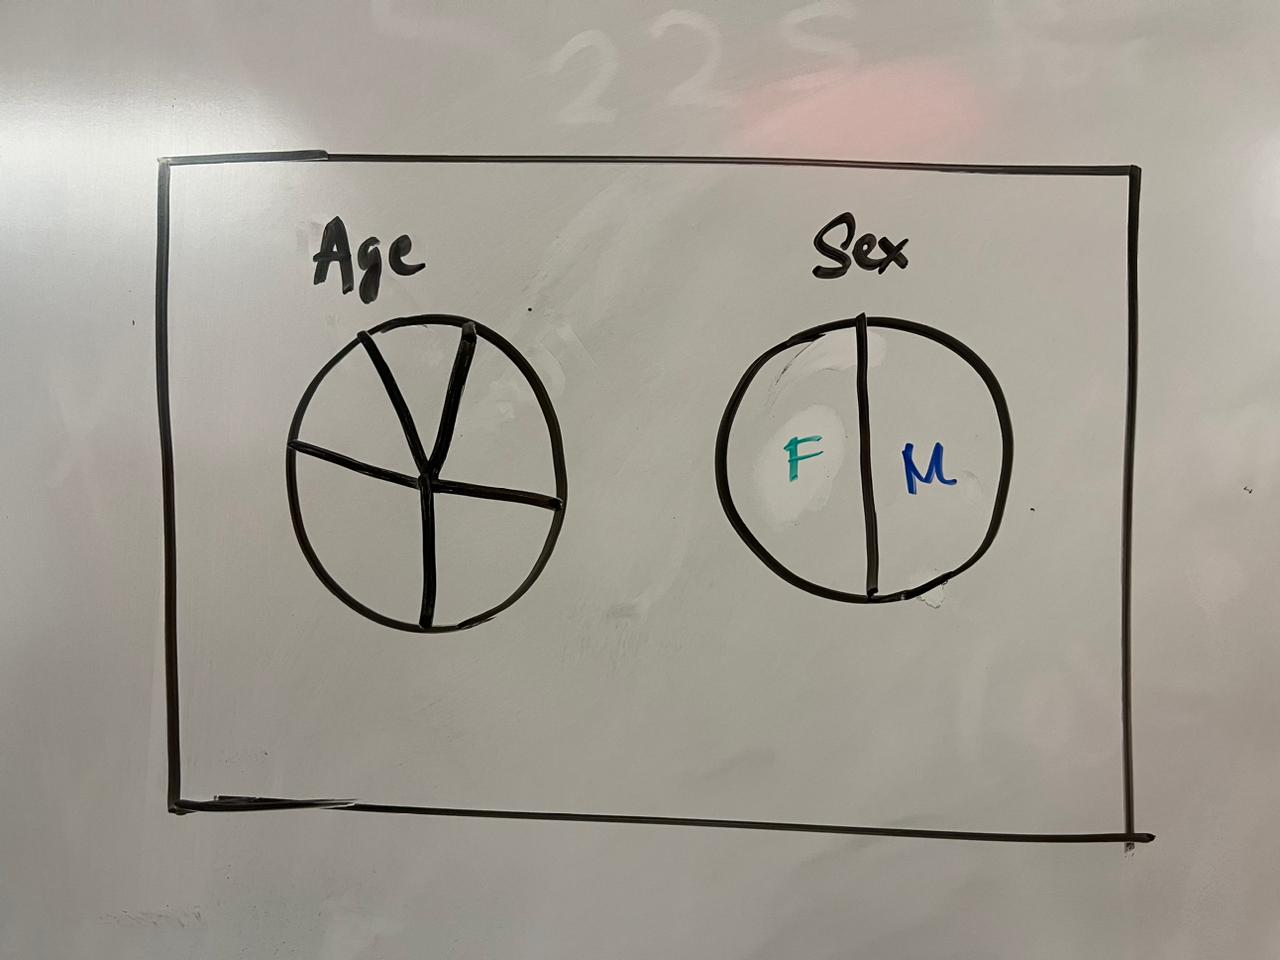
I created two pie charts, one of which depicts the percenatge ratio of people affected by cholera based on the sex, another pie chart depicts different type of age groups which is affected by the disease.
Design Choices
I started by designing and thinking about how can I display the soho map and the graphs required. I drew some UI designs by hand to get an overview about how will I be able to fit the maps and the graphs on the screen without a need to scroll down the page. By importing the dataset and starting to map the street lines of it, I tried to align the map on the left corner of the page so that other graphs would fit besides it. Implementing the map exactly the way it should look was a task and I had to keep debugging the code many a times to make it look good and interpret the results properly. I struggled on giving both the pie charts a way to communicate with the Soho map using the tooltip. Aligning all the graphs in a way that I had designed was also a task for me. I was not able to fit the pie charts on the same page, they had to be scrolled down to see the whole graph. While creating the timeline chart I had to refer a lot of different sites to get an idea of how to create it using an interactive interface, although I was not able to create that feature I have just implemented the chart which show the dates and deaths.
Observations
The Map gives us an overview about how the females are affected more as compared to the ratio of males. It also gives the description about the persons affected by cholera and a specific region around the broad street is highly infected by it. The most affected age group is above 80 and most affected sex is female. The timeline graph shows a spike in number of deaths from 1st Sept-2nd Sept, this is rapid increase in count of people on the marked day. The pie chart shows that the percentage of male and female affected by cholera epidemic is both 50%, it is likely that female is a bit more but that ratio is very negligible.